Help
How are PDF charts built?
High-granularity charts from the full 14,400-point dataset.
Cydiance PDF temperature charts are built from the complete trip dataset — up to 14,400 readings per logger. Charts are designed to preserve temperature excursions and support operational review, not to collapse data into an oversimplified trend line.
Granularity and presentation
Chart rendering uses the full recorded dataset together with a presentation algorithm that retains as much detail as the PDF format allows. The objective is to surface meaningful events — including short temperature spikes — so reviewers can identify critical periods and support traceability decisions.
Comparison example
The screenshot below is from a customer validation test: a Cydiance C0 and a competitor logger were placed in close proximity and operated simultaneously. Timestamps differ because of time-zone settings on each device; the comparison is otherwise aligned.
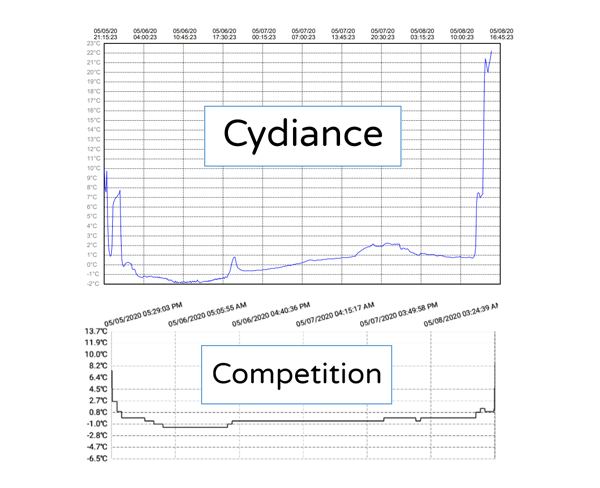
The Cydiance chart retains fine-grained variation, including recorded spikes that may be smoothed or omitted in competing reports. This level of detail helps teams locate key events, focus on periods of interest, and document conclusions from the temperature record.